Acknowledgements
Design of experiment: Gabby Yordanova and Randy Janson
Page design: Isis Romero
DOE
Design of Experiment
-
Step 1: Identify the performance variables, design variables, and uncontrolled factors.
-
Performance Variables:
-
Assembly time as a function of number of parts and labor wage index
-
-
Design Variables:
-
Number of parts
-
Combining the frame channels with the front cover
-
Combining the staple holder assembly to be one part
-
Combing the end part of the pusher rod assembly
-
-
Design for assembly as a factor in reducing assembly time
-
-
-
Uncontrolled factors:
-
Learning curve
-
Assembly instructions (or the lack of instructions)
-
Environmental effects, such as noise, light, etc
-
-
Step 2: Define the target values for the response and boundaries for the design variables.
-
Target value for Assembly Cost: $4.00
-
Boundaries:
-
Number of parts ∈ [17, 21]
-
Labor Wage Index ∈ [4 (U.S.), 17 (China)]
-
-
-
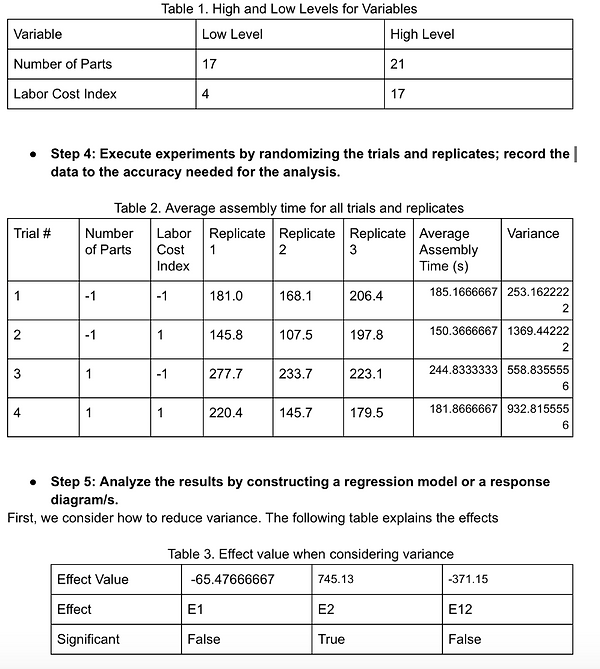
Step 3: Plan the prototype testing by developing an experimental matrix, choosing the number of trials, levels for each design variable, number of replicates, and how the responses will be measured. Also, determine the experimental apparatus and methods for eliminating uncontrolled variables.
-
Trials: 2^2 = 4
-
2 Levels (refer to Table 1)
-
We used 3 replicates per combination of number of parts and labor wage index in order to provide a better estimate of assembly time
-
How to measure response: We asked different people to assemble the stapler to reduce the effect of the learning curve, and we timed them. We collected data for both the new and the old stapler (number of parts) as well as providing 2 different levels of incentives (representing high and a low wage index).
-
Experimental apparatus: stopwatch
-
Methods for eliminating uncontrolled variables:
-
We had the same person giving assembly instructions each time
-
We used different people every trial to eliminate the effect of a learning curve on our results
-
We had the test subjects assemble the stapler in the same spot to reduce environmental effectsTesting variables:
-
# of parts per product
-
Labor Cost
-
-

Determine the System Characteristic equation to predict output:
Y = Y+E12x1
Determine the System Characteristic equation to predict output:
Since only the first factor (Number of parts) is in fact significant, the recommended process is Number of parts (-).
To reduce both the noise and the assembly time, the recommended outputs are:
Number of parts (-), wage index (-)
Because the number of parts directly affects the assembly time, we decided to keep out stapler to the theoretical minimum number of parts we found. In this way, a lower number of parts means less assembly time, which means a lower cost of assembly. Also, it turned out that a lower wage index, such as one in China compared to the U.S will also have some effect in reducing production time. The wage index is just an estimation since we tested it through means of incentives. A better way to test that is get an actual data from different production facilities. Even though aPriori tells us cost analysis, it doesn’t give us assembly time, which we could’ve used as a reference.